Over the past couple of weeks, I’ve added a few enhancements to Alignvote.
Summary of Sentiment
How are end-users answering the survey? Now you can see a summary.
From the Voters Guide homepage, see the “Voter Sentiment” section. This shows you a rolled-up summary of how people are answering the quiz. As clearly described at the top of the page, this is NOT a scientific poll, nor is it represented as such. There are numerous reasons why this cumulative score might not reflect the reality in the race itself, including but not limited to duplicate quiz entries, selection bias of those taking the quiz, ineligible voters filling it out and more. But I thought some people might be interested in seeing what the cumulative inputs are.
All stances are shown, listed in descending order of stances taken, as in the partial screenshot below. Where the percentages don’t add up to 100%, the remainder is the percentage of respondents who chose not to answer that question. (Note that Alignvote doesn’t require that you answer all questions.)
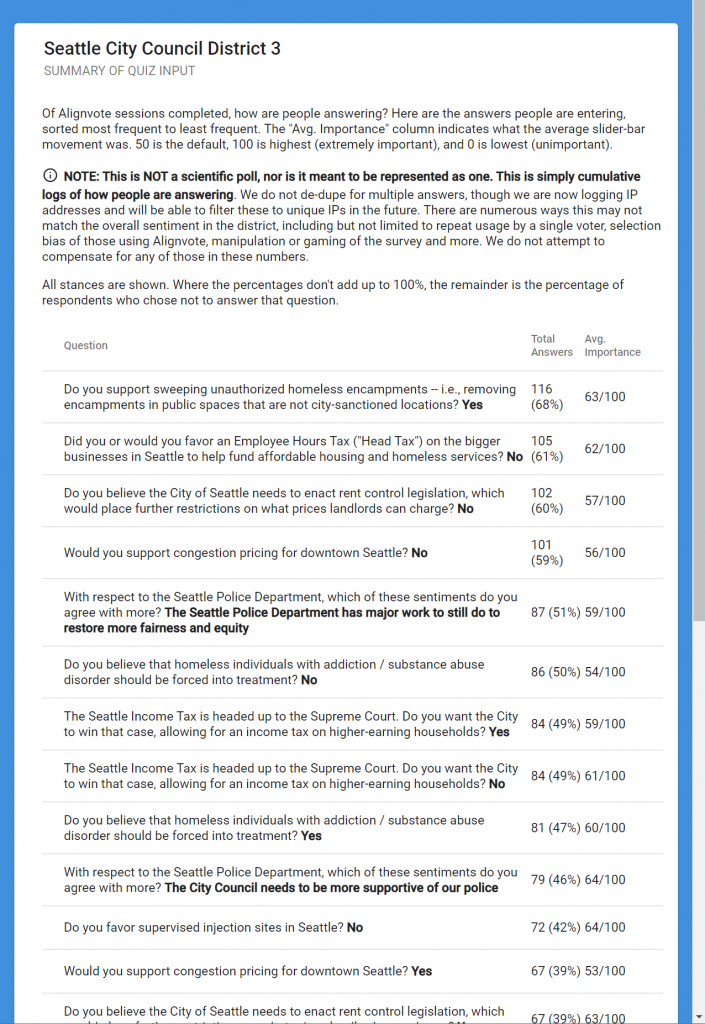
As of 10/28/2019, here’s a snapshot for the results in the different Seattle City Council races:
D1-summary-10-28-2019 D2-summary-10-28-2019 D3-summary-10-28-2019 D4-summary-10-28-2019 D5-summary-10-28.2019 D6-summary-10-28-2019 D7-summary-10-28-2019Live View
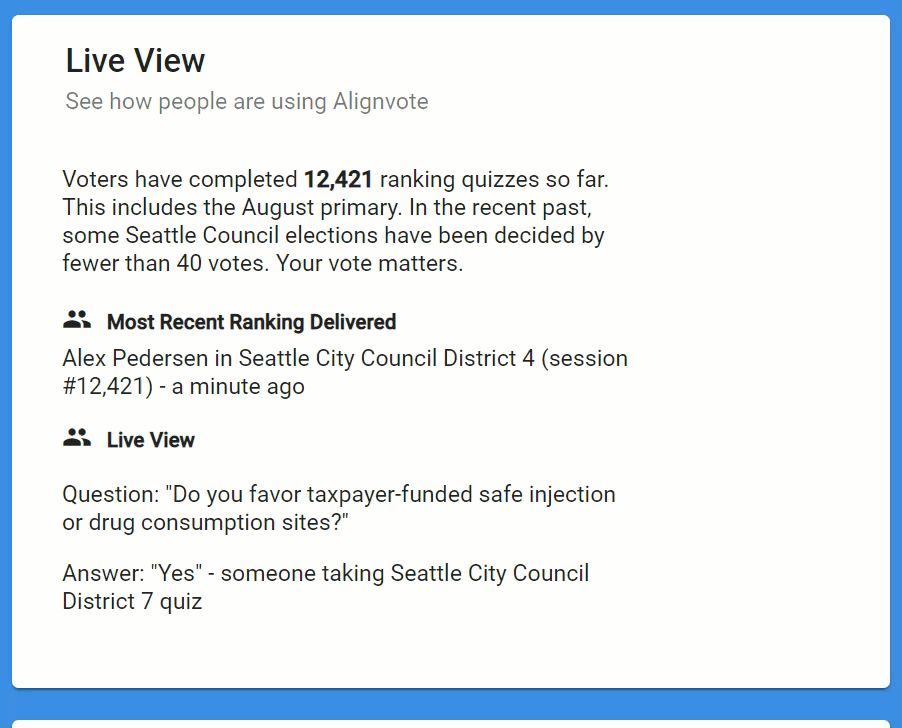
On the homepage, you’ll see a Live View snapshot of the most recent top-ranking as well as people entering the survey.