Survivorship Bias
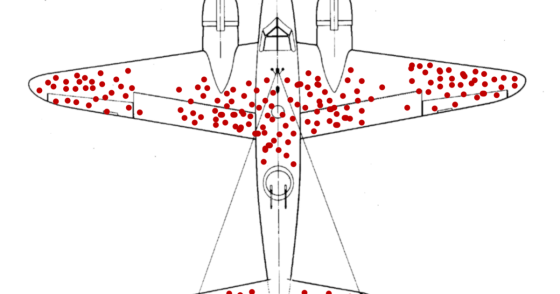
In WWII, researcher Abraham Wald was assigned the task of figuring out where to place more reinforcing armor on bombers. Since every extra pound meant reduced range and agility, optimizing these decisions was crucial. So he and his team looked at a ton of data from returning bombers, noting the bullet hole placement.
They came up with numerous diagrams that looked like this:

Most of his team members observed “Wow! Look at all those bullet holes in the center of the fuselage and on the wing tips! The armor clearly ought to go there, because those are the areas that are most marked-up in red!”
But Wald realized that they were only looking at those bombers which SURVIVED, and he correctly argued that these areas were instead precisely the damage areas that were already most survivable, while the areas which were NOT marked by bulletholes meant they were fatal. In so doing, he helped us understand “survivorship bias” — that is, if we only sample from the successful outcomes, we avoid seeing the crucial factors that caused failure, which in many cases are the most important factors of all.
Such survivorship bias can lead to conclusions and strategies which are precisely the opposite of optimal, so pay attention to the datapoints that you may have already artificially and incorrectly eliminated.