Which Seattle Restaurants Have Had the Most Closures Forced by Inspectors?

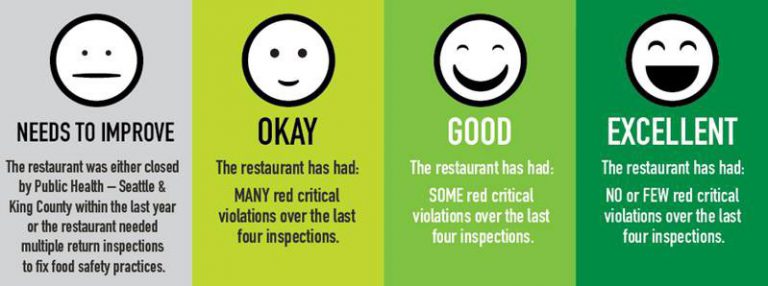
King County’s Restaurant Inspection Grades, which is based upon the average of red-card violations in the past four inspections

I’m exploring the Python stack for data analysis and machine learning.

I know I’m late to the party, but have only recently discovered the impressive Jupyter Notebook (formerly IPython) data analysis platform and community. It makes “storytelling from data” easy. But doing so with ease requires fluency with a sometimes unintuitive yet very powerful syntax.

Today’s question: Which Seattle-area restaurants have been forced to close the most often by restaurant inspectors?

For this morning’s project, I headed on over to a local Starbucks, tapped into wifi, and downloaded the King County Restaurant Inspection dataset.

King County’s restaurant inspection policies are spelled out here, and violations generally fall into “red” (serious) or “blue” (non-serious) violations. Red violations can and often do result in forced temporary closure of the restaurant.

Now, for this SQL-guy, importing the data file into a database and doing a simple GROUP BY query would make this question easy to answer, but for my Python learning purposes, that’d be cheating. I want to learn a bit about data visualization and pattern recognition.

After a little bit of munging of the data, I came out with the list below, which shows restaurant name and the total distinct closure-worthy moments. Surprising to me that some were such repeat offenders. Really, Anjappar Chettinad? Inspectors forced closure five separate times?

From January 2006 until March 2018, there have been 181 distinct restaurant closures in the Seattle area by inspection.

Some, like Anjappar Chettinad Indian Restaurant, King Buffet and 663 Bistro, have been closed multiple times. You can see that the list of inspection-forced-closures is heavily weighted toward international (i.e., Indian, Chinese, Thai, Vietnamese and Mexican) restaurants, but also includes a few taverns, hot dog street vendors, delis and coffee shops.

Here’s a scatter plot of where these closures have taken place (as you can see, I haven’t yet gotten geo heatmaps sorted out yet — I’ll be exploring folium or other geo-plotters in the future.) But it seems to show that the major areas are South Lake Union and Queen Anne:

Pace of Closures by Year

Let’s see how closures have paced by year (2018 is partial, through mid-March 2018):

Interesting — what’s going on here? Why was 2007–2010 a down-period, particularly 2010? Was that a particularly careful, healthy year? That seems unlikely. Possible explainers: economic effects reducing inspections? Measurements not recorded in the same format? Or was something else going on?

Looking at total inspections by year, we can clearly see that it’s not because of cutbacks in inspections. Here are the total unique inspections (i.e., unique restaurant/date pairs) by year, through mid-March 2018:

So there’s a steady increase in inspections from year to year. Don’t know exactly why 2010 was such a closure-light year, or why 2008–2010 trended down; my current hypothesis is that there was a policy change, or perhaps less aggressive inspections, that made these more lenient.

Distribution of Grades

Just how bad is it, comparatively speaking, when you see a “Needs Improvement”, or even an “Okay” sign? You may have anecdotally noticed that it’s pretty rare when you glance at the door and see one of these two grades. Here’s a histogram — one per inspector visit — and the resultant grades assigned, since 2006 (1=Excellent, 2=Great, 3=Okay, 4=Needs Improvement.)

What I take away from the above is that “Okay” and “Needs Improvement” are real outliers.

For more info, you can check out the King County Restaurant Inspection lookup system here: https://www.kingcounty.gov/depts/health/environmental-health/food-safety/inspection-system/search.aspx#/

https://gist.github.com/stevemurch/ccac0123600cefdc7314d0524a449f8b.js

Restaurants that have an “Okay” Grade as of March 28 2018:

0          ANJAPPAR CHETTINAD INDIAN RESTAURANT
1                                 ARAYA'S PLACE
2                                    BIG BAZAAR
3                                   CASA PATRON
4                                  CHAAT N ROLL
5                                   CHINA FIRST
6                               CROSSROADS CAFE
7                                     FOODSHION
8                                  GALLO DE ORO
9                     GOLDEN INDIAN CURRY HOUSE
10                                   GREEK PITA
11             GREEN LEAF VIETNAMESE RESTAURANT
12                       HALAL MARWA RESTAURANT
13                                   HAWAII BBQ
14    HOMEGROWN SUSTAINABLE SANDWICH SHOP-KIOSK
15                        HUNAN CHINESE KITCHEN
16                              HYDERABAD HOUSE
17                             Hung Long Market
18                              ICHIRO TERIYAKI
19                                   J B GARDEN
20            KING'S CHINESE SEAFOOD RESTAURANT
21                                    LOCAL PHO
22                 LOTUS ASIAN KITCHEN & LOUNGE
23                          LUNCHBOX LABORATORY
24                        MARINEPOLIS SUSHILAND
25                             MIRAK RESTAURANT
26                              Niko's Teriyaki
27                         PABLA INDIAN CUISINE
28                          PEN THAI RESTAURANT
29                                 PHO VIET ANH
30                                    RUBY THAI
31                          SAIGON VIETNAM DELI
32                           SAM'S NOODLE HOUSE
33                           SEOUL TOFU HOUSE 2
34                               SUNNY TERIYAKI
35                         SUSHIMARU RESTAURANT
36                     SZECHUAN CHEF RESTAURANT
37                            THAI CURRY SIMPLE
38                                  THAI ON 1ST
39                          TIENDA LATIN MARKET
40                                  U:DON FRESH
41                                   UDUPI CAFE
42                                      YU SHAN

Restaurant name, total number of red-cards shown below.

More than one red card can and often is handed out per visit — so the number of actual closures is significantly less than the numbers below:

663 BISTRO 57
ANJAPPAR CHETTINAD INDIAN RESTAURANT 53
KING BUFFET 49
SPICED TRULY CHINESE CUISINE 32
ROYAL INDIA 30
UDUPI CAFE 24
SICHUANESE CUISINE 23
MIDORI TERIYAKI 22
OH! INDIA 21
CURBSIDE (KC225) 20
BIG BAZAAR 20
CAFE PHO II, INC. 17
GOLDEN DAISY RESTAURANT 17
ICHIRO TERIYAKI 17
BLUE FIN & SEAFOOD 17
GREEN LEAF VIETNAMESE RESTAURANT 16
BEBAS & AMIGOS 16
TOP GUN OF BELLEVUE 16
YU SHAN 15
BENTO BOX, THE 14
MACKY’S DIM SUM 14
KING’S CHINESE SEAFOOD RESTAURANT 13
HANABI SUSHI RESTAURANT 13
YOKO 3 13
SAIGON DELI 13
TERIYAKI BISTRO 13
FORTUNE GARDEN RESTAURANT 12
J B GARDEN 12
HYDERABAD HOUSE 12
HANAHREUM MART 11
HARBOR CITY RESTAURANT 11
YUMMY PHO 11
MAYURI FOODS & VIDEO 11
KABAB PALACE 10
SEADLE HOUSE 10
SILVER SPOON THAI RESTAURANT 10
SAFFRON SPICE 10
CAFE PHO 10
MEDITERRANEAN MIX 9
KUNG HO GOURMET CHINESE RESTAURANT 9
LA PINA/TRES HERMANOS 9
SEATTLE DELI 9
HONG KONG BISTRO 9
ASIA BBQ & FAST FOOD 9
SEOUL TOFU HOUSE 2 9
CEDARS BROOKLYN DELI 9
HUNAN CHINESE KITCHEN 8
MAHARAJA CUSINE OF INDIA 8
IKIIKI 8
TOULOUSE PETIT KITCHEN & LOUNGE 8
SKILLET STREET FOOD, LLC 8
FEAST 8
SUNNY TERIYAKI 8
MAZATLAN RESTAURANT 8
RANCHO BRAVO TACOS #1 8
LOTUS ASIAN KITCHEN & LOUNGE 8
TAQUERIA GUADALAJARA 8
PALACE KOREAN GRILL 8
LOCAL PHO 7
PARKSIDE DELI & SUNDRIES 7
MIRAK RESTAURANT 7
COUNTRY SIDE CAFE 6
FAMOUS RANDY 6
MUNCH BOSS (KC465) 6
IMPERIAL GARDEN & HAPPY TUMMY 6
13 COINS 6
THAI ON 1ST 6
THAI CHEF 6
SMALL FRYE’S 6
PIONEER GRILL@VARAMINI COMMISSARY 6
MUSTARD SEED CAFE 5
PHO TAI 5
CHU MINH TOFU & VEGETARIAN DELI 5
GRILL CITY 5
NORTHWEST CATERING #9 5
LA RIVIERA MAYA #2 4
GOURMET DOG JAPON 4
JEMIL’S BIG EASY 4
RAM RESTAURANT & BREWERY 4
PEOPLE’S BURGER@VARAMINI COMMISSARY 4
ROMIO’S PIZZA & PASTA 4
TAQUERIA EL ASADERO 4
DONA QUEEN DONUT & DELI 4
DRAGONFISH ASIAN CAFE 4
SAM’S NOODLE HOUSE 4
SAMURAI NOODLE 4
LA PLAYA MEXICAN RESTAURANT 4
HOMEGROWN SUSTAINABLE SANDWICH SHOP-KIOSK 3
HALLAVA FALAFEL LLC 3
N W HASIMO FAST FOOD AND DELI 3
STOPWATCH ESPRESSO 3
MANCHU WOK AT SEA-TAC 3
RACHA NOODLES & THAI CUISINE 3
SUBWAY #25524-O 3
EL CAMION 3
CHUCK E CHEESE’S 3
THAI CURRY SIMPLE 3
BIG BAWARCHI 3
AL’S GOURMET SAUSAGE #5 3
RAIN DOGS SODO, CART #2 3
LANPONI THAI RESTAURANT 3
PHO THU THUY 3
TAQUERIA EL CORRAL #1 2
BEST CORN #1 2
SUNSET FRIED CHICKEN 2
BOUMBA HOTDOG 2
GREAT WESTERN PACIFIC 2
MCDONALD’S SAMMAMISH #5523 2
YUMBIT (KC298) 2
DANTE’S INFERNO (1) 2
CAFE ZUM ZUM 2
MAIN ST GYROS 2
QDOBA #2618 2
HOW TO COOK A WOLF 2
OASIS TEA ZONE 2
Hung Long Market 2
I LOVE MY GFF 2
LUNCHBOX LABORATORY 2
CAFFE BEE 1
BLAZEN (KC547) 1
THAI 2 G0 1
THAI BISTRO RESTAURANT 1
CHIPOTLE MEXICAN GRILL #2228 1
LT’S FAMOUS BBQ 1
QUARTER CHUTE CAFE 1
BISTRO BAFFI 1
OSTERIA DA PRIMO 1
PHI KAPPA SIGMA 1
NEEMA’S 1
BENEVOR, INC 1
BEEZNEEZ GOURMET SAUSAGE (KC287) 1
TOSHI’S TERIYAKI 1
TUKWILA DELI 1
ART MARBLE 21 1
VOXX COFFEE 1
ANGELO’S PIZZA & PASTA 1
7-ELEVEN STORE #2361–27283C 1
WORLD WRAPPS — REI 1
MEDITERRANEAN KITCHEN 1
COWGIRLS ESPRESSO 1
CHURCH’S CHICKEN 1
GERALDINE’S COUNTER 1
RAM RESTAURANT & BIG HORN BREWERY 1
JUISALA 1
KFC #332 1
POTBELLY SANDWICH SHOP 1
KING OF PHO 1
SANDHU SHELL MINI-MART 1
Niko’s Teriyaki 1
HALLAVA FALAFEL 1
Genki Sushi 1
KIRKLAND AMERICAN LITTLE LEAGUE 1
PING’S FOOD MART 1
GARAM MASALA AND SPICES 1
CLASS ACT 1
FULL LIFE CARE 1
FREMONT HOT DOG 1
SUBWAY 1
LA RUSTICA 1
LA VITA E BELLA (KC222) 1
LADYBUG ESPRESSO 1
TACO GOL TAQUERIA 1
CROSSROADS CAFE 1
QDOBA MEXICAN EATS 1
COURTYARD BY MARRIOTT — STARBUCKS 1
COFFEE TIME 1
MARINEPOLIS SUSHILAND 1

Another question: What Seattle Zip Codes have had the most “type red” (serious) violations? I haven’t quite figured out how to display counts on a heatmap just yet, but it turns out the answer is 98109, which includes Queen Anne and South Lake Union:

Note that I haven’t yet divided by inspection frequency, that’s simply the nominal leader. It could certainly be because that’s where more restaurants are, or where more inspections have been scheduled. Will likely take a look at that in a future update.

Comparing Trump and Hillary Clinton on Twitter

I’ve been dusting off my machine learning/data-science skills by diving into Python, which has become a lingua franca (along with R) of the data analysis world. Python’s libraries for data analysis and visualization are really superb and can make quick work of complex data analysis tasks.

Sentiment Analysis

Today, it’s possible to use computers to quantify, with reasonable accuracy, the emotional “sentiment” of an utterance, determining if it is fundamentally positive, negative or neutral in nature. This is called “sentiment analysis,” and is a very fertile area for some really interesting projects.

Looking around for basic topics to put new Python learnings to the test, I thought it’d be fun to take a look at the Twitter sentiment and “virality” of two famous tweeters: realDonaldTrump and hillaryclinton.

Using basic data science techniques, it seemed possible to know answers to questions such as:

  • Which of the two is currently more negative on Twitter?
  • Are Trump’s Twitter followers more “viral” than Clinton’s?
  • Under what conditions do their followers tend to like and retweet their messages?
  • When one of them goes negative, how do their followers respond?
  • etc.

[Update: I’ve just discovered jupyter, which would be the ideal platform to write this up in.]

Caveats

This is only the result of about 90 minutes of work, meant as a fun “throwaway” project to help me learn the frameworks. This is not university-level, peer-reviewed research. There are numerous caveats, and I caution against over-interpreting the data.

The two biggest caveats: First, the problem of Twitter bots is real, and well known. Twitter is fighting them, but it’s impossible to say with the data below just how much that impacts the data. Still, the results of the data below suggests to me that Trump probably has more bots that just retweet and like what he says, regardless of content.

Second, note that I’m using only the most basic “sentiment analysis” library: textblob. This is prone to false positives, as it looks word-by-word and does not accurately measure sentiments in the case of, for instance, double-negatives. This is experimental, and meant solely for learning and fun. Several tests I’ve run across have shown it to only be about 83–85% accurate.

Results

Nevertheless, here’s the result of the analysis as of March 13, 2018, looking at their last 200 tweets:

What jumped out at me

  • Trump has 2.2x as many followers as HRC. OK, duh. We don’t need python for that. But this is important to keep in mind for the table above, so it’s first off the bat. Said another way, if the audiences were relatively equal, you’d expect similar ratios to retweets, likes, and responses to negative or positive expressions.
  • HRC’s followers are significantly more “viral,” on a per-capita basis — they like and retweet on a “per-capita” basis much moreso than do Trump’s. While Trump has 2.2x as many followers, he only has 69% more “likes” from his followers; HRC’s followers are about twice as active, in general in liking/retweeting what she writes. Looking at her last 200 tweets:
  • Trump’s followers are equally likely to RT Trump regardless of whether what he writes is positive, negative or neutral. Another way to think of this is that no matter what Trump says, a sizable percentage of his core followers will retweet it. (One plausible theory — see “bots” above. He may well have more of them.)
  • Note the substantial dropoff of retweets for Trump (and not for Clinton) around the end of February and early March, 2018. One hypothesis (I’ve not yet checked) is that this was due to a purge of bots by Twitter.
Likes and Retweets over Time: Hillary Clinton: Much higher per follower than Trump’s
Likes and Retweets over Time: Donald Trump’s — Steadier Likes, Regardless of content

Most Retweeted Tweet, Trump (in past 200):

Lowest rated Oscars in HISTORY. Problem is, we don’t have Stars anymore — except your President (just kidding, of course)!

Most Retweeted Tweet, Clinton (in past 200):

RT @BillKristol: Two weeks ago a 26-year old soldier raced repeatedly into a burning Bronx apartment building, saving four people before he died in the flames. His name was Pvt. Emmanuel Mensah and he immigrated from Ghana, a country Donald Trump apparently thinks produces very subpar immigrants.
https://twitter.com/BillKristol/status/951637572576477184?utm_campaign=crowdfire&utm_content=crowdfire&utm_medium=social&utm_source=twitter

Code

# General:
import tweepy           # To consume Twitter's API
import pandas as pd     # To handle data
import numpy as np      # For number computing
# For plotting and visualization:
from IPython.display import display
import matplotlib.pyplot as plt
import seaborn as sns
#%matplotlib inline
from textblob import TextBlob
import re
# We import our access keys:
from credentials import *    # This will allow us to use the keys as variables
# API's setup:
def twitter_setup():
"""
Utility function to setup the Twitter's API
with our access keys provided.
"""
# Authentication and access using keys:
auth = tweepy.OAuthHandler(CONSUMER_KEY, CONSUMER_SECRET)
auth.set_access_token(ACCESS_TOKEN, ACCESS_SECRET)
# Return API with authentication:
api = tweepy.API(auth)
return api
# We create an extractor object:
extractor = twitter_setup()
# We create a tweet list as follows:
tweets = extractor.user_timeline(screen_name="hillaryclinton", count=200)
print("Number of tweets extracted: {}.n".format(len(tweets)))
def clean_tweet(tweet):
'''
Utility function to clean the text in a tweet by removing
links and special characters using regex.
'''
return ' '.join(re.sub(r"(@[A-Za-z0-9]+)|([^0-9A-Za-z t])|(w+://S+)", " ", tweet).split())
def analyze_sentiment(tweet):
'''
Utility function to classify the polarity of a tweet
using textblob.
'''
analysis = TextBlob(clean_tweet(tweet))
if analysis.sentiment.polarity > 0:
return 1
elif analysis.sentiment.polarity == 0:
return 0
else:
return -1
# We print the most recent 5 tweets:
print("5 recent tweets:n")
for tweet in tweets[:5]:
print(tweet.text)
print()
# We create a pandas dataframe as follows:
data = pd.DataFrame(data=[tweet.text for tweet in tweets], columns=['Tweets'])
# We display the first 10 elements of the dataframe:
display(data.head(10))
data['len']  = np.array([len(tweet.text) for tweet in tweets])
data['ID']   = np.array([tweet.id for tweet in tweets])
data['Date'] = np.array([tweet.created_at for tweet in tweets])
data['Source'] = np.array([tweet.source for tweet in tweets])
data['Likes']  = np.array([tweet.favorite_count for tweet in tweets])
data['RTs']    = np.array([tweet.retweet_count for tweet in tweets])
# We create a column with the result of the analysis:
data['SA'] = np.array([ analyze_sentiment(tweet) for tweet in data['Tweets'] ])
# We display the updated dataframe with the new column:
display(data.head(10))
# We extract the mean of lengths:
mean = np.mean(data['len'])
print("The average length of tweets: {}".format(mean))
# We extract the tweet with more FAVs and more RTs:
fav_max = np.max(data['Likes'])
rt_max  = np.max(data['RTs'])
fav = data[data.Likes == fav_max].index[0]
rt  = data[data.RTs == rt_max].index[0]
# Max FAVs:
print("The tweet with more likes is: n{}".format(data['Tweets'][fav]))
print("Number of likes: {}".format(fav_max))
print("{} characters.n".format(data['len'][fav]))
# Max RTs:
print("The tweet with more retweets is: n{}".format(data['Tweets'][rt]))
print("Number of retweets: {}".format(rt_max))
print("{} characters.n".format(data['len'][rt]))
# Mean Likes
meanlikes = np.mean(data["Likes"])
meanRTs = np.mean(data["RTs"])
print("Mean likes is {}".format(meanlikes))
print("Mean RTs is {}".format(meanRTs))
# Time Series
tlen = pd.Series(data=data['len'].values, index=data['Date'])
tfav = pd.Series(data=data['Likes'].values, index=data['Date'])
tret = pd.Series(data=data['RTs'].values, index=data['Date'])
# Lengths along time:
# tlen.plot(figsize=(16,4), color='r')
# Likes vs retweets visualization:
tfav.plot(figsize=(16,4), label="Likes", legend=True)
tret.plot(figsize=(16,4), label="Retweets", legend=True)
plt.show()
rts2likes = pd
pos_tweets = [ tweet for index, tweet in enumerate(data['Tweets']) if data['SA'][index] > 0]
neu_tweets = [ tweet for index, tweet in enumerate(data['Tweets']) if data['SA'][index] == 0]
neg_tweets = [ tweet for index, tweet in enumerate(data['Tweets']) if data['SA'][index] < 0]
print("Percentage of positive tweets: {}%".format(len(pos_tweets)*100/len(data['Tweets'])))
print("Percentage of neutral tweets: {}%".format(len(neu_tweets)*100/len(data['Tweets'])))
print("Percentage of negative tweets: {}%".format(len(neg_tweets)*100/len(data['Tweets'])))
# Mean Likes of Positives
pos_tweet_likes = [ tweet for index, tweet in enumerate(data['Likes']) if data['SA'][index] > 0]
pos_tweet_rts = [ tweet for index, tweet in enumerate(data['RTs']) if data['SA'][index] > 0]
pos_likes_avg = np.mean(pos_tweet_likes)
pos_RTs_avg = np.mean(pos_tweet_rts)
print("Mean likes of pos_tweets is {}".format(pos_likes_avg))
print("Mean RTs of pos_tweets is {}".format(pos_RTs_avg))
# Mean Likes of Negatives
neg_tweet_likes = [ tweet for index, tweet in enumerate(data['Likes']) if data['SA'][index] < 0]
neg_tweet_rts = [ tweet for index, tweet in enumerate(data['RTs']) if data['SA'][index] < 0]
neg_likes_avg = np.mean(neg_tweet_likes)
neg_RTs_avg = np.mean(neg_tweet_rts)
print("Mean likes of neg_tweets is {}".format(neg_likes_avg))
print("Mean RTs of neg_tweets {}".format(neg_RTs_avg))
# Mean Likes of Neutrals
neutral_tweet_likes = [ tweet for index, tweet in enumerate(data['Likes']) if data['SA'][index] == 0]
neutral_tweet_rts = [ tweet for index, tweet in enumerate(data['RTs']) if data['SA'][index] == 0]
neutral_likes_avg = np.mean(neutral_tweet_likes)
neutral_RTs_avg = np.mean(neutral_tweet_rts)
print("Mean likes of neutral tweets is {}".format(neutral_likes_avg))
print("Mean RTs of neutral tweets {}".format(neutral_RTs_avg))

Acknowledgements

Thanks much to this informative article by Rodolfo Farro for the jumpstart.