
Which Seattle candidate most agrees with you? Take the all-new Alignvote quiz.
Which candidate most agrees with you in the Seattle 2021 general election? Take the all-new Alignvote quiz to find out.

Which candidate most agrees with you in the Seattle 2021 general election? Take the all-new Alignvote quiz to find out.

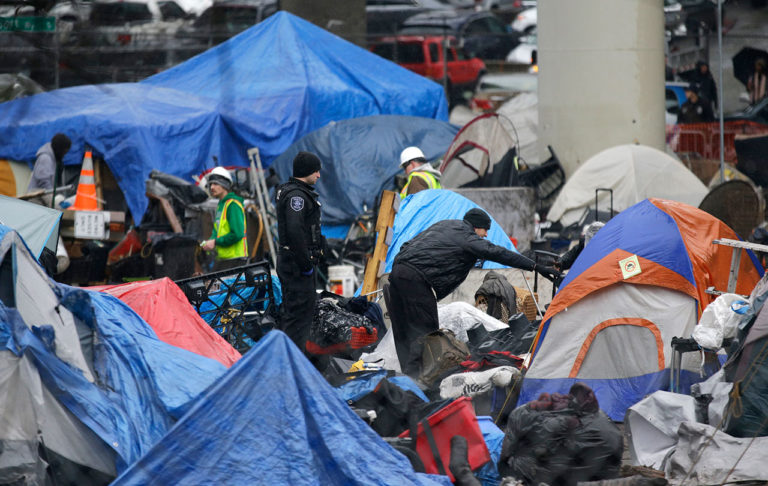
Part III of my 3-part series featured in Post Alley about the big issues in the upcoming Seattle election. Today’s post: the city’s approach toward homelessness, and a summary of the key “slates”: the more Leftward Slate vs. the more Moderate slate.
If you or other voters are just coming up to speed on the big issues facing us with this election about the direction of our city, feel free to share this three-part series on zoning, crime and homelessness.

Part II in a three-part series, in which I ask questions of the eight campaigns in the Seattle November 2nd General Election and hand the microphone to them. Today’s question: Should Seattle essentially end criminal prosecution for misdemeanors, including shoplifting, property destruction and misdemeanor assault?
In this three-part series, I’m taking a close look at 3 key issues at the heart of the 2021 Seattle November 2nd General Election. Today’s post focuses on residential zoning.
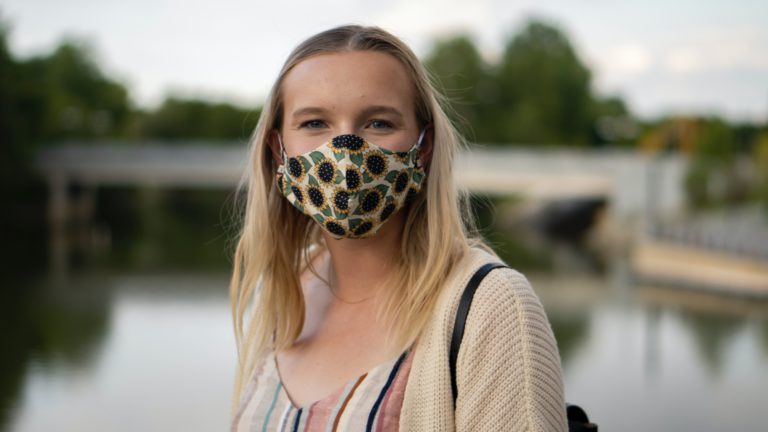
Why must those least at risk be deprived of the most? Mask mandates reduce opportunities for enjoyment and fulfillment at school, yet they don’t even show compelling evidence they work.

Catching up with the latest organizational endorsements for the August 3rd, 2021 Primary for Seattle
The Stranger’s recommendations have occupied the key policy setting positions in Seattle, other than mayor, for quite some time. They’re no longer the outsiders; they’re the insiders. If you love the Seattle City Council, you should follow The Stranger’s endorsements yet again.
When major outcome indicators are all moving in the wrong direction, and the process which generates these outcomes remains utterly broken for years, and even political allies describe the body one leads as dysfunctional, one should not get a promotion to an even higher position of responsibility.
What’s happened to the $3 million that City Council allocated for research to feed into participatory budgeting?

Seattle City Council signals a veto-proof majority for a 50% cut in police funding. But where are the metrics?